Introduction
The UK climate is getting warmer in recent decades and extreme heat events are becoming more frequent and more intense, causing important public health challenges [1]. The highest heat-associated deaths were observed in 2022 across five heat episodes, resulting 2,985 excess deaths [2]. Recently, It is estimated that the heat-associated deaths were 2,877 during the two heat episodes in May and June 2026 [3]. These alarming events have reinforced the importance of adapting places and populations to increasingly hot weather. Much of this adaptation involves the built environment, which affects how hot a neighbourhood becomes and how much of that heat residents are exposed to.
Heat is not spread evenly across a city. Built materials like brick, tarmac and concrete absorb heat through the day and release slowly overnight while trees, grass and open water cool the air around them. This result is the urban heat island which cities are warmer than countryside and some neighbourhoods run warmer than others. In the UK, urban environment developed under cooler climatic conditions and were not designed with higher temperatures, resulting uncomfortable and potentially hazardous outdoor thermal conditions.
At the same time, national and local policy actively promotes walking and active travel because they bring substantial health benefits such as boosting physical activity and eventually improving population health [4]. Birmingham has taken this further than most. The Birmingham Transport Plan prioritises active travel including walking and cycling as the primary way for people to get around their locality. Birmingham city council is also developing the liveable neighbourhoods programme to deliver services and infrastructure at neighbourhood scale in Bordesley Green and East Birmingham pilot area, so that residents can access goods, services and facilities they need for a full and healthy life within a short walk or public transport journey of home [5].
The ambition is sound but the evidence-based approaches do not seem to consider the heat exposure that the neighbourhoods increasingly experienced. If residents are encouraged to walk for everyday journeys, are the neighbourhoods designed to also suitable for walking under increasingly hot conditions?
A neighbourhood built to be walk-supportive may have higher street network connectivity, good access to transit stops and a diverse mix of employment and housing. However, under hot weather, this could create a mismatch between walk-supportiveness and the thermal environment in which walking takes place. This raises a question whether neighbourhoods in Birmingham that are best set up for walking also the hottest? If they are, policies that aim to improve health are pulling against each other on the same streets.
To investigate this, Lee et al. developed the Heat–Walkability Mismatch Index (HWMI), identifying small areas in San Antonio where high walkability coincided with high land surface temperature, and examining whether this mismatch was socially patterned [6]. This analysis follows their approach and exact methodology as closely as possible and apply to comparable data sets for Birmingham. Specifically, this analysis examines:
- whether high walkability and high surface heat exposure coexist within Birmingham;
- whether heat–walkability mismatch exhibits significant spatial clustering; and
- whether social vulnerability is associated with heat exposure, walkability and HWMI.
View the project code on GitHub.
Methods
Study area
This analysis examines Birmingham at a Lower Layer Super Output Area (LSOA) level at 2021 boundaries (n=659). Birmingham is ranked as the second most deprived local authority district in England and the largest population being served by its council in the Europe. These characteristics make Birmingham an important setting for examining the spatial relationship between heat exposure, walkability and social vulnerability.
Heat
Heat exposure was represented using Land Surface Temperature (LST) derived from Landsat 8 imagery. A clear-sky hot-weather scene with <10% cloud coverage captured on 12 of July 2026 was used. The LSOA level LST values were then calculated using area-weighted average.
Walkability
Unlike Lee et al., US Environmental Protection Agency (EPA) National walkability index was easily obtained and used in their study but there are no equivalent data for England. The author of this analysis thus developed the England walkability index prior to this study, published on author's github. The method of generating the England walkability index is the same as the US one and the components of the index are:
- street intersection density;
- proximity to public transport;
- employment mix;
- employment and household mix.
Further details in the methodology can be found in the US EPA relevant technical reports and in author's github.
Social vulnerability
A range of indicators were used to construct the social vulnerability score. These indicators are publicly available including socioeconomic conditions, health, age, household composition and demographic characteristics. To calculate the overall social vulnerability score, principal component analysis with varimax rotation was employed to identify common components from a collection of relevant indicators. Two rotated components (RC) were retained using the standard criteria where eigenvalues greater than one:
- socioeconomic and health disadvantage;
- demographic and household composition.
The following table shows the RC scores of each index under two RCs.
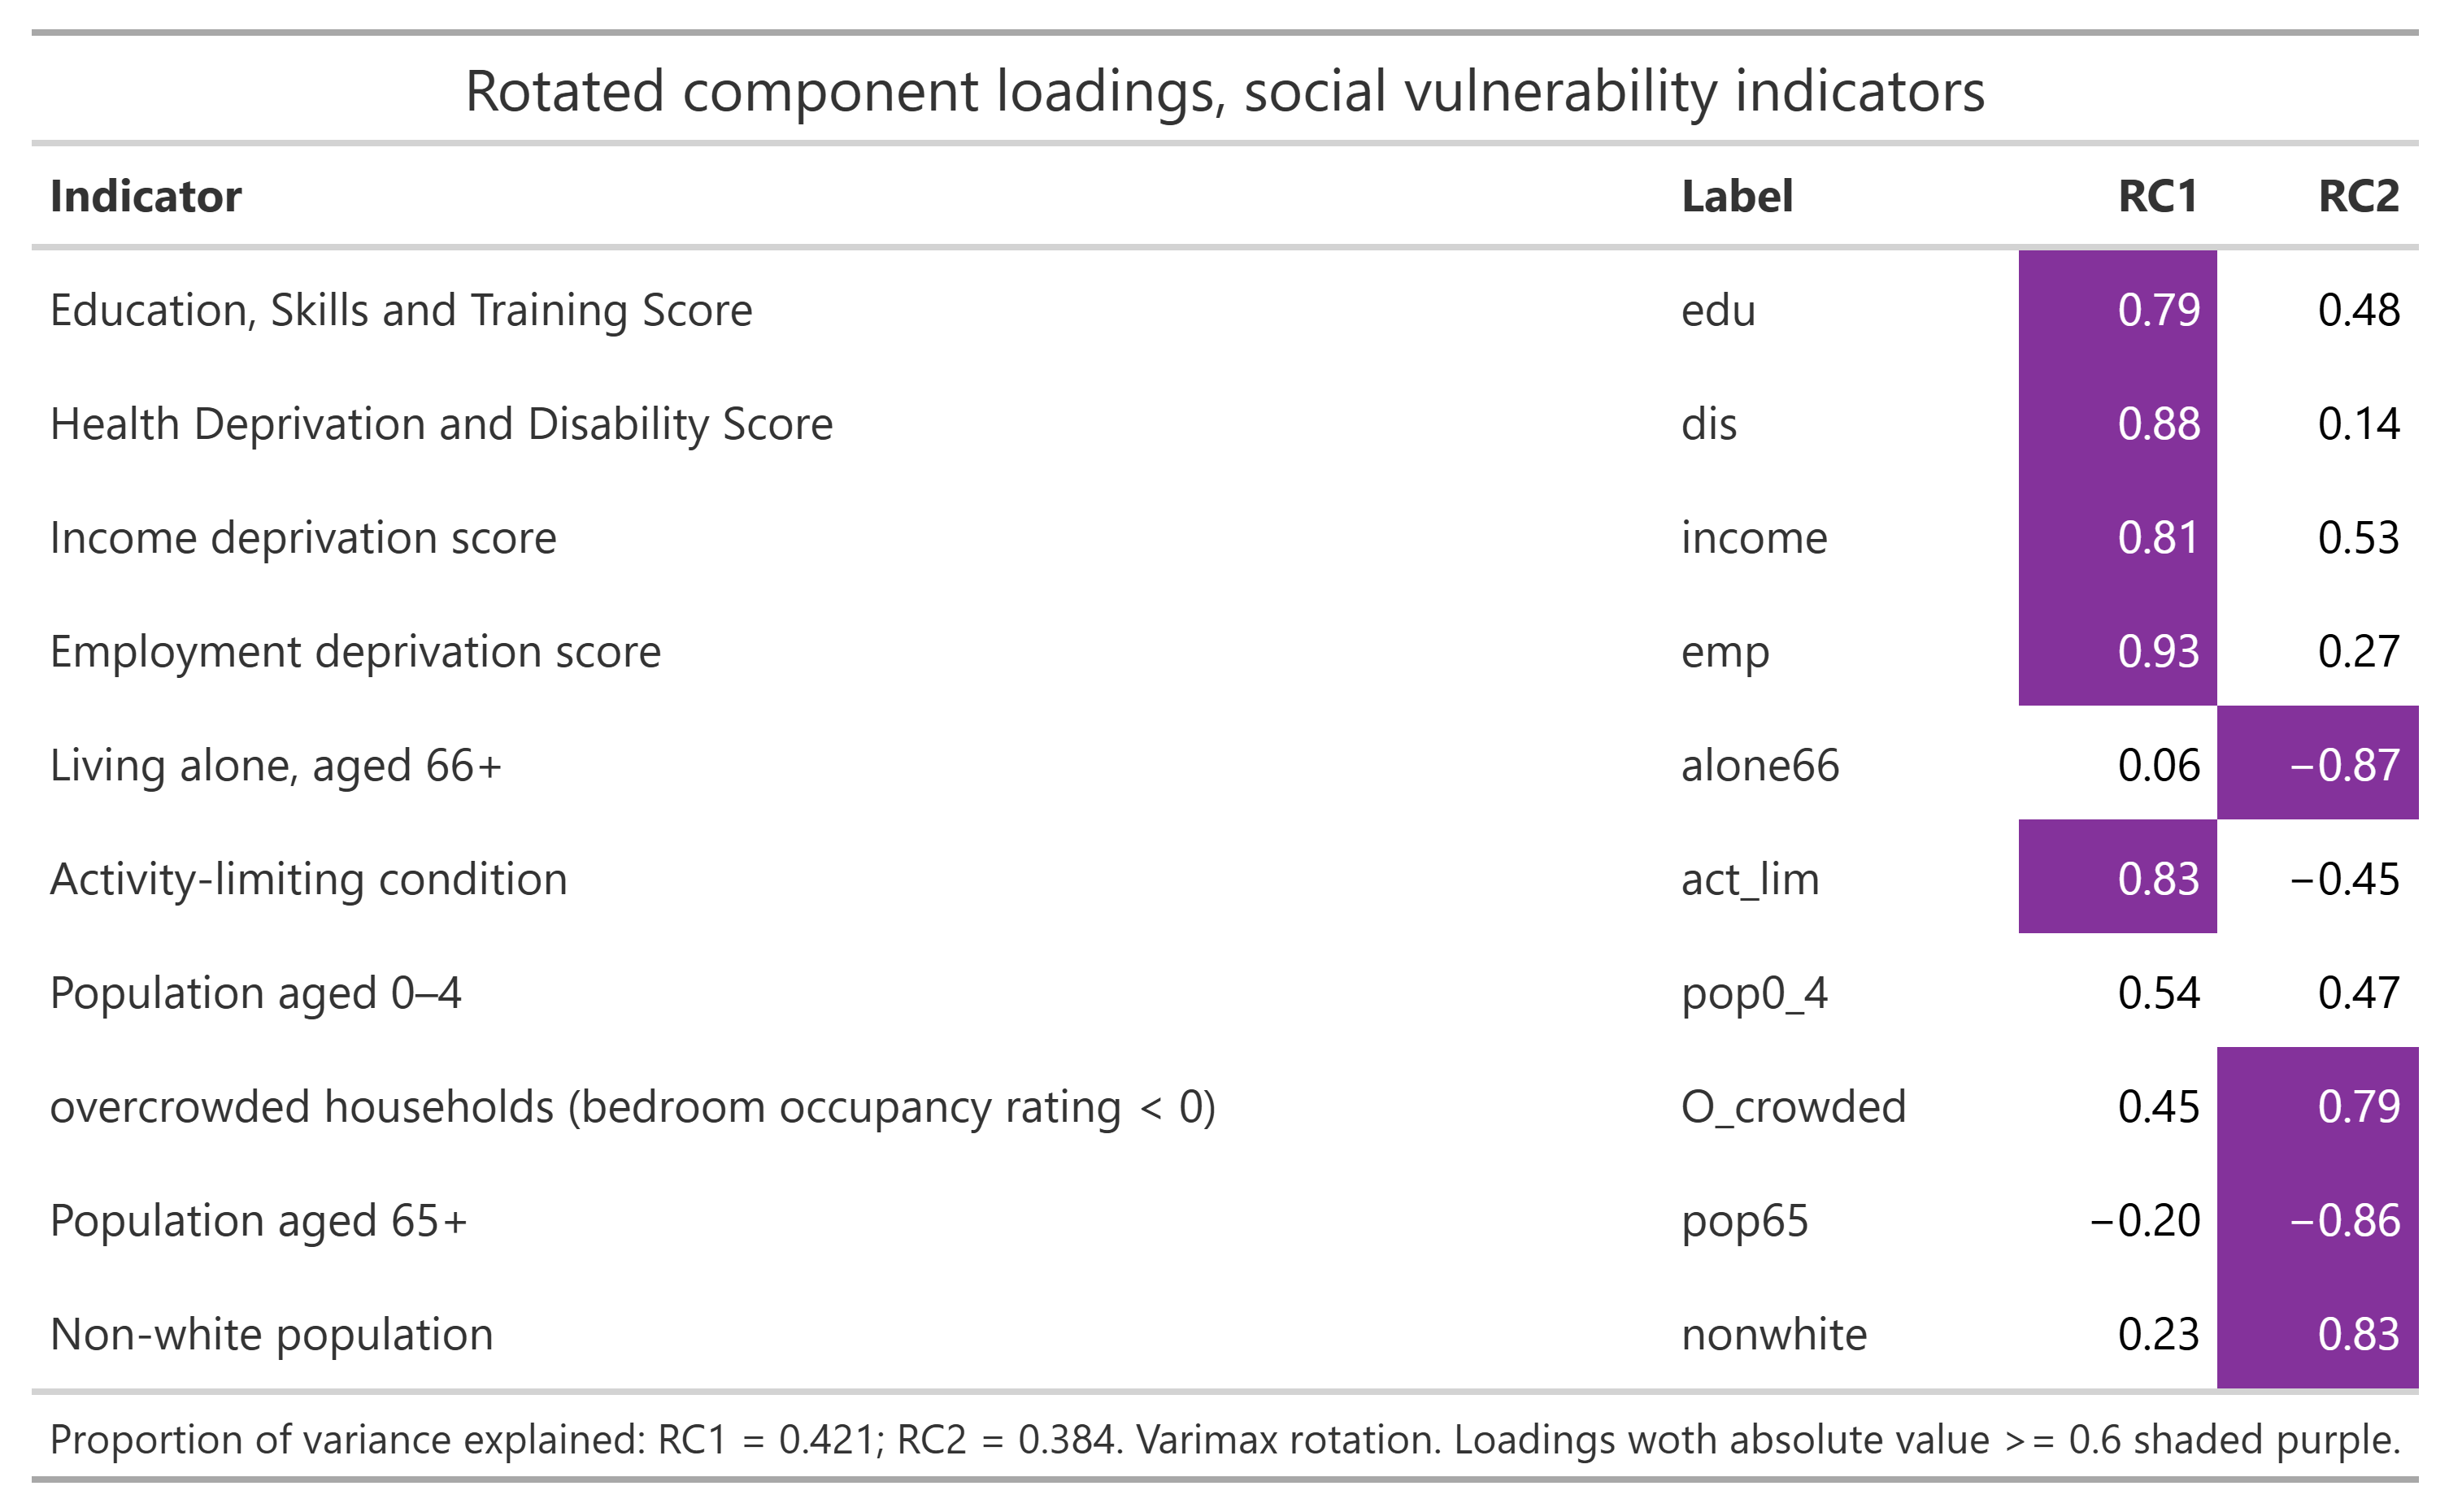
RC2 score was strongly bipolar in Birmingham, where strong negative loadings were obtained for older age and older people living alone and moderate positive loadings for younger ages and non-white population. As both ends of a bipolar component may represent different dimension of vulnerability, the absolute value of the standardised RC2 was used following the approach used by a previous study [7].
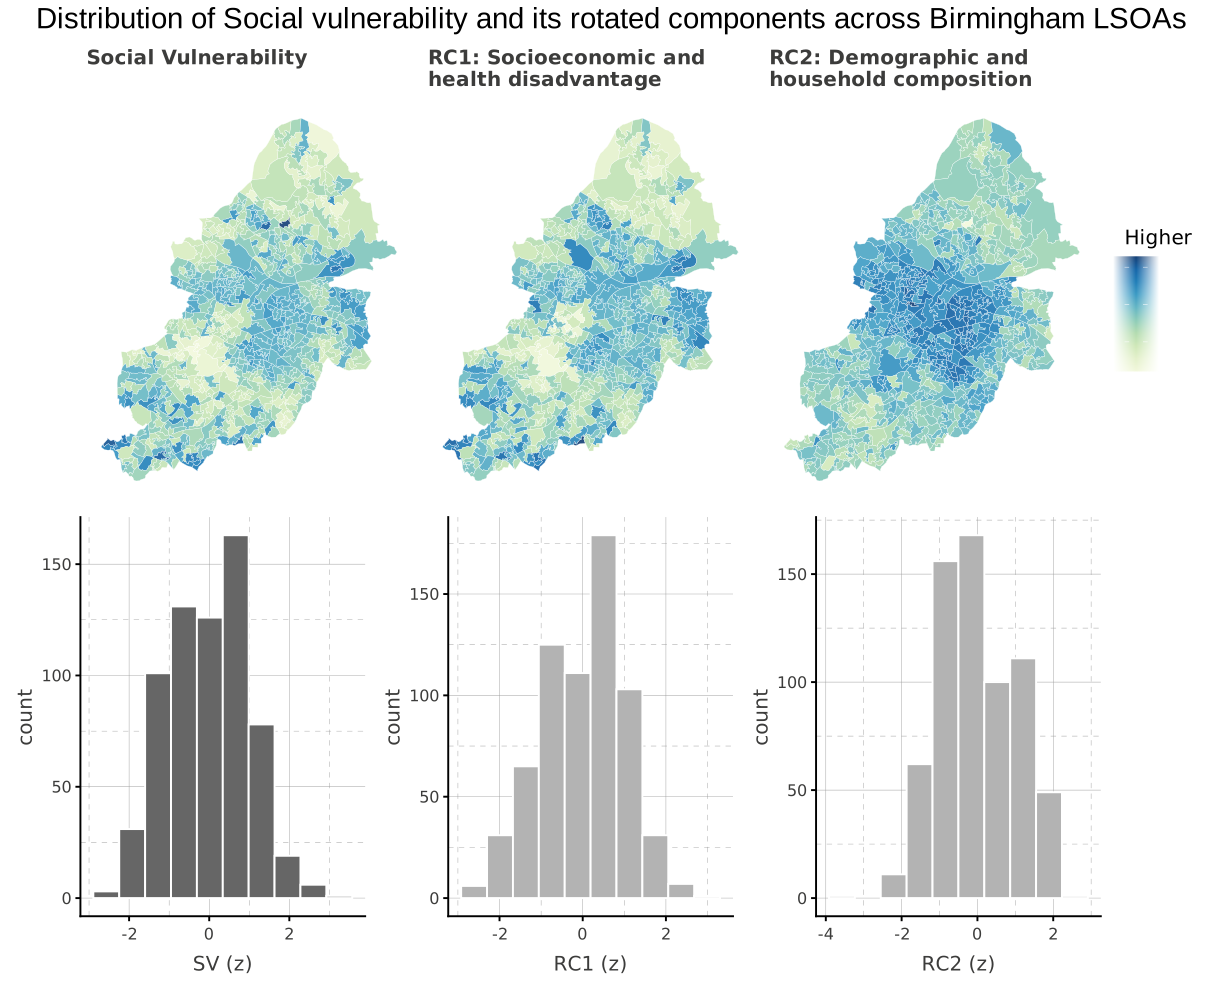
To construct the overall social vulnerability (SV) score, both RC1 and RC2 were first standardised. The overall score was calculated by summing the standardised RC1 score and the absolute value of standardised RC2 score. Finally, the overall SV score was subsequently standardised across Birmingham and is presented below.
Heat–Walkability Mismatch Index (HWMI)
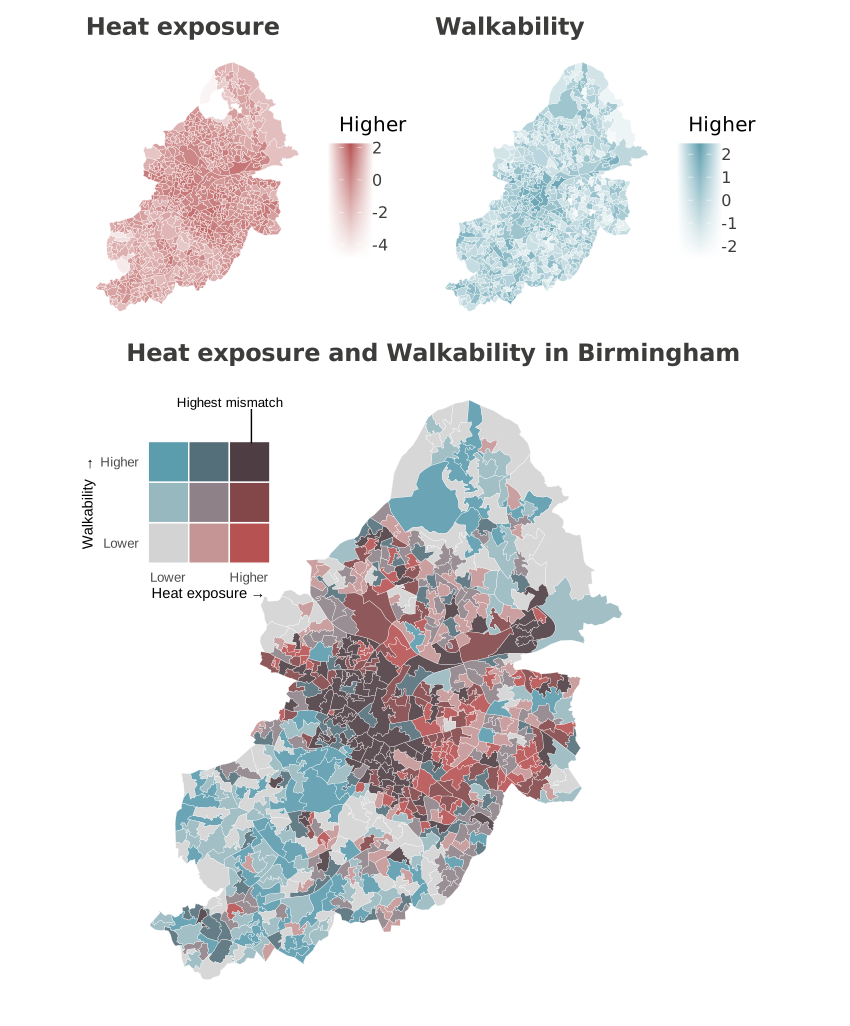
Heat exposure, Walkability and the bivariate distribution of both variables were firstly explored in the figure below. Regarding to the individual heat exposure and walkability maps, areas with darker colours imply higher heat exposure and higher walkability respectively. The pattern suggests that the centre of Birmingham contains LSOAs with higher heat exposure and higher walkability at the same time.
The pattern is more obvious when looking into the bivariate overlay of both variables where darker brown colour represents the highest mismatch LSOAs found in Birmingham and most of these highest mismatches tend to be concentrated around the central of Birmingham.
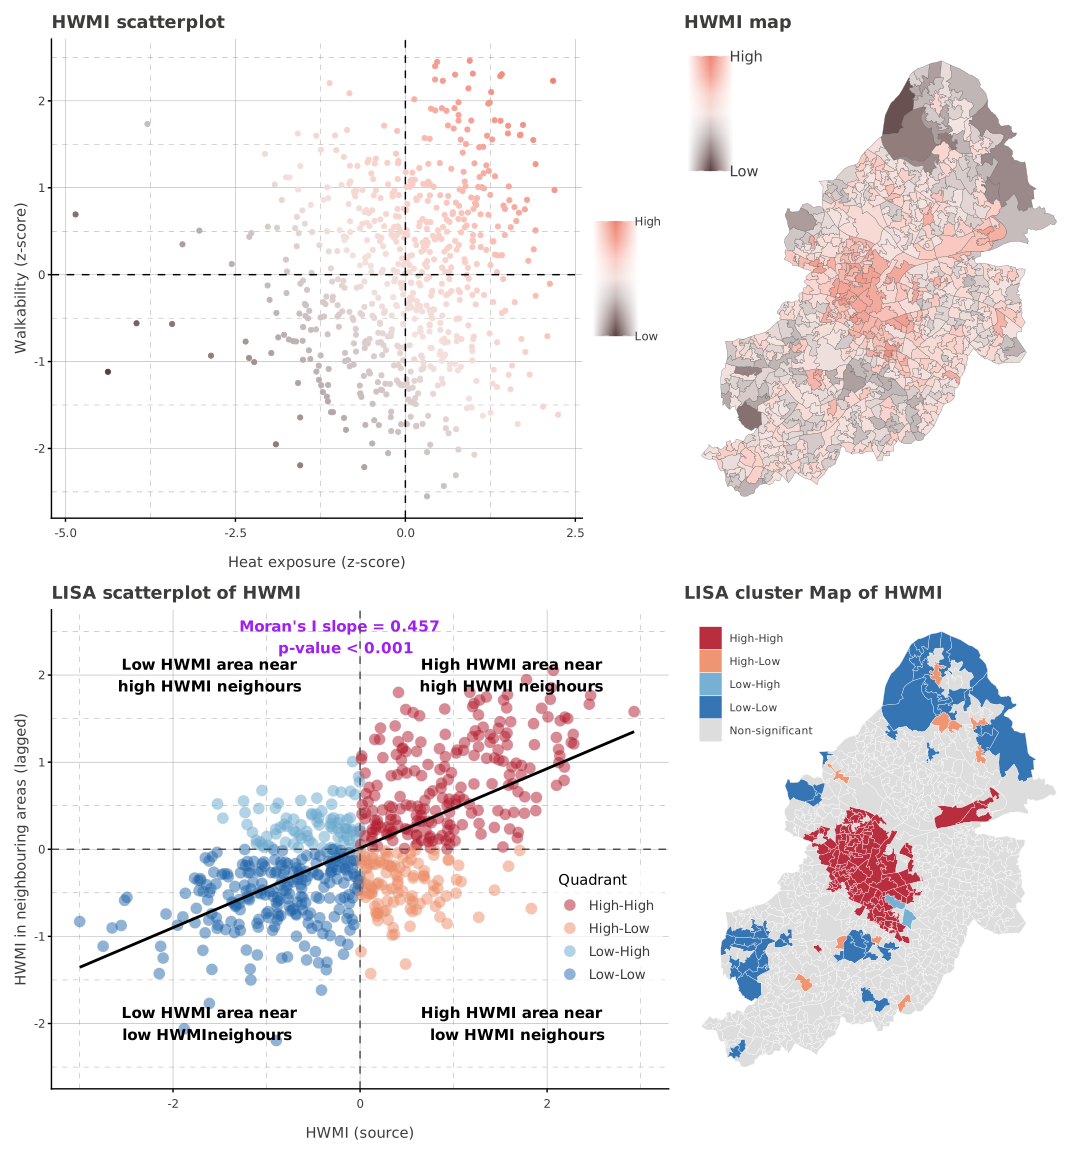
To construct the HWMI, Heat exposure (LST values) and England Walkability index (subset to Birmingham) were first standardised. The two standardised measures were then summed together with equal weighting to produce the HWMI, following the approach of Lee et al. [6]. Higher positive HWMI z-scores indicate a greater combined level of heat exposure and walkability relative to the Birmingham average, with the highest values identifying neighbourhoods where high heat exposure and high walkability coincide most strongly. Conversely, negative HWMI z-scores should not be interpreted as either lower heat exposure or lower walkable environment but instead indicating lower degree of mismatch. HWMI z-scores close to zero could imply both measures cancelling out (higher heat exposure and lower walkability; lower heat exposure and higher walkability) or both measures are close to their respective averages.
Spatial analysis
Potential spatial clustering of the mismatch between neighbouring LSOAs were represented using Queen contiguity and row-standardised spatial weights. The Global Moran's I was used to assess the overall degree of spatial clustering and in Birmingham to determine whether the observed spatial pattern differed significantly from spatial randomness. To further identify where are those clusters concentrated locally, the Local Indicators of Spatial Association (LISA) was then used.
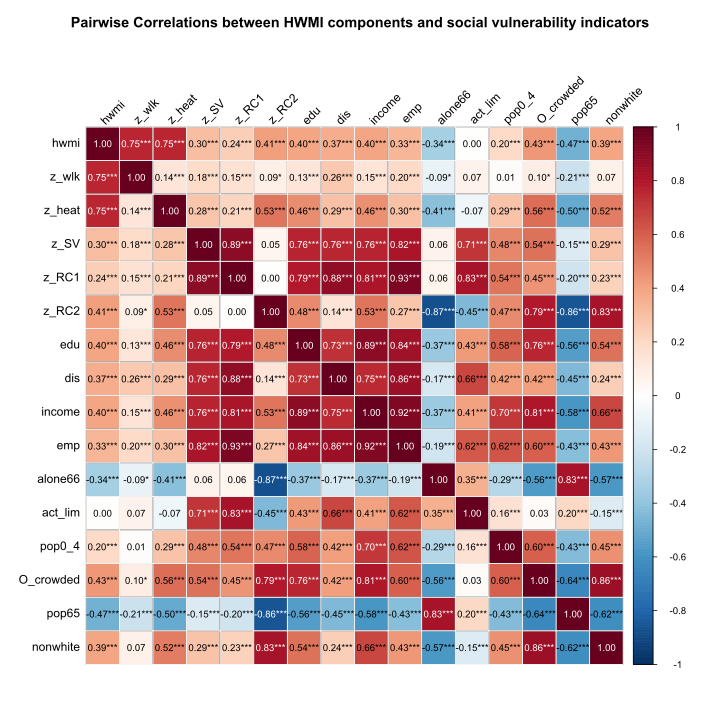
To examine whether HWMI is socially patterned, pairwise Pearson correlations were first calculated between HWMI, standardised heat exposure, standardised walkability, the standardised overall social vulnerability (SV) score and the individual indicators used to construct SV. The correlation provides initial descriptive assessment of the direction of relationships between the variables.
After that, a series of spatial autoregressive regression models were estimated following Lee et al. approach [6]. Prior to fitting the spatial regression models, adjusted Rao's Score tests confirmed that a spatial lag should be used, suggesting strong evidence of spatial lag dependence. The spatial lag models were fitted separately for:
- heat exposure (M1, M2);
- walkability (M3, M4);
- HWMI (M5, M6).
For each outcome, models were fitted against both the individual RC components and the overall SV score. Models were also controlled for single parent with dependent child (served as single-family housing unit), proportion of vacant dwellings and second homes, population density, renter share and distance to Birmingham city centre. These control variables were or retained after running another correlation test with no correlations larger than 0.65.
Data sources
| Measure | Dataset / source | Year | Role |
|---|---|---|---|
| Heat exposure | Landsat 8 Land Surface Temperature | 2026 | Standardised heat component of HWMI |
| Walkability | England Walkability Index developed by the author | 2021–2026 inputs | Standardised walkability component of HWMI |
| Social vulnerability | Census and deprivation indicators | 2021 and 2025 | PCA-derived RC1, RC2 and SV |
| Control variables | Census | 2021 | Control variables for regression models |
| Spatial boundaries | ONS LSOA boundaries | 2021 | Spatial unit of analysis |
Results
Spatial clustering
HWMI exhibited significant positive spatial autocorrelation across Birmingham (Moran's I = 0.457, p<0.001), indicating that the spatial distribution of HWMI is potentially clustered rather than random spatial pattern. The LISA provided further evidence of clear spatial clustering of HWMI in the central area of Birmingham presented below.
Correlation between HWMI and SV
Pairwise correlations were initially conducted to describe the relationship between variables. The figure below shows the correlation matrix, where red represents positive correlations and blue represents negative correlations. HWMI and SV showed a significant positive correlation (r = 0.3, p < 0.001). Significant positive correlations were also found between HWMI and other variables relating to socioeconomic and health disadvantage. When the two components of HWMI were examined separately, differences in their relationships with social vulnerability were apparent. It was found that heat exposure showed a stronger correlation with RC2 (measuring demographic and household composition) than walkability. This correlation pattern might suggest the relationship between SV and HWMI was more closely associated with variation in heat exposure than variation in walkability.
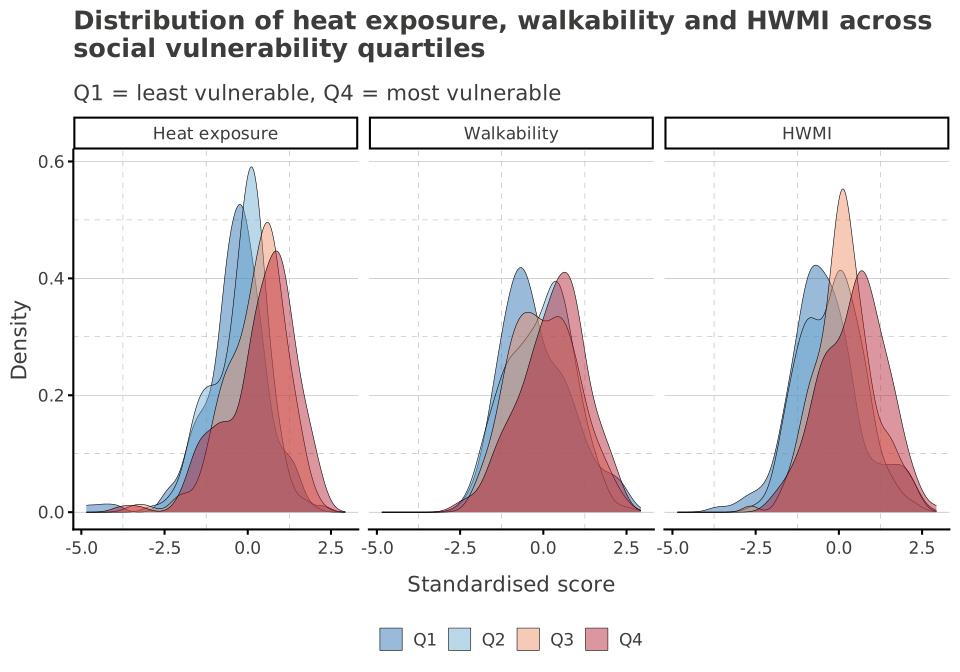
The distribution of heat exposure, walkability and HWMI across four SV quartiles (Q4 indicates highest SV quartile) are presented below. The plot seemed to suggest that higher SV quartiles were skewed more to the left, indicating with more socially vulnerable neighbourhoods tending to have higher heat exposure, walkability and HWMI scores.
Association between HWMI and SV
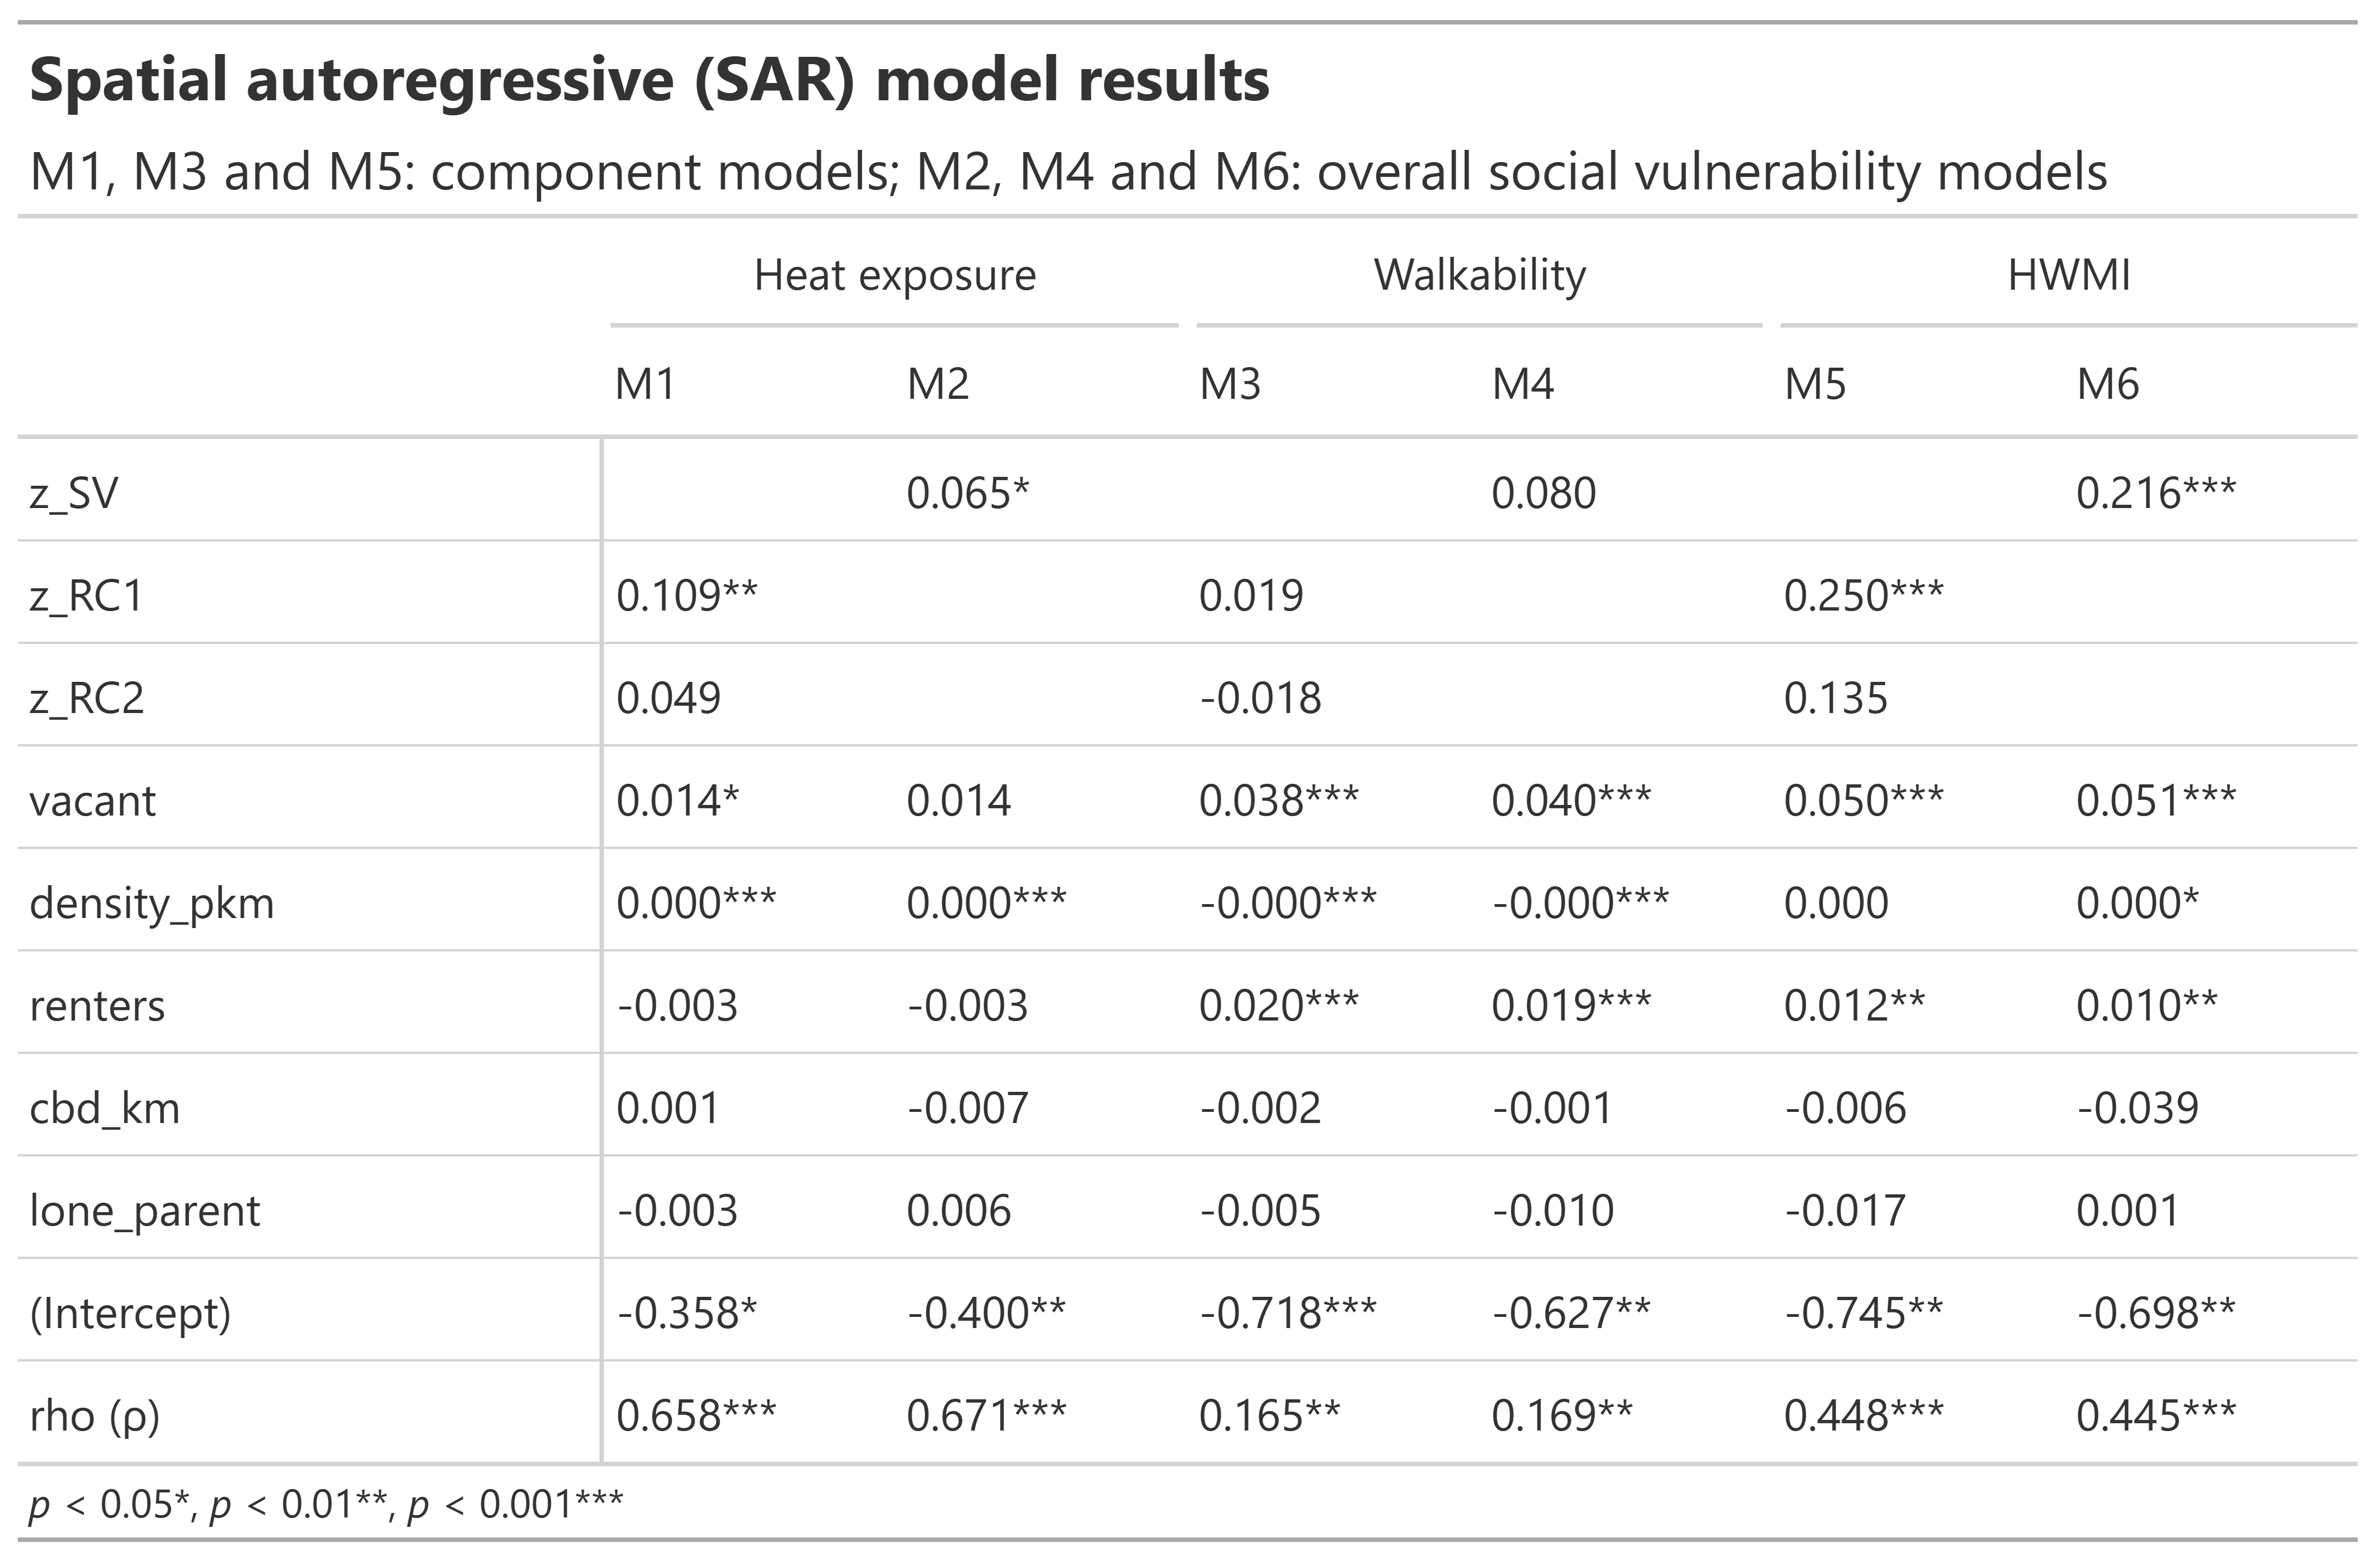
The table below presents the result from six spatial lag regression models examining heat exposure, walkability and HWMI.
For heat exposure, RC1 was significantly positively associated with heat exposure (M1: β = 0.109, p < 0.01), suggesting that areas with higher socioeconomic and health disadvantage experienced higher heat exposure. RC2 was not significantly associated with heat exposure. SV was significantly positively associated with heat exposure (M2: β = 0.065, p < 0.05).
For walkability, neither RC1 nor RC2 showed statistically significant associations in M3. SV was also not significantly associated with walkability in M4.
The strongest magnitude of associations were observed for HWMI. RC1 was significantly positively associated with HWMI (M5: β = 0.250, p < 0.001). RC2 was not significantly associated with HWMI. In M6, SV showed a clear positive association with HWMI (β = 0.216, p < 0.001).
Several control variables showed statistically significant associations with the outcomes. Population density (density_pkm) showed a positive association with heat exposure but a negative association with walkability. Renter share was positively associated with walkability and HWMI. Vacant dwellings and second homes also showed positive associations except M2.
The spatial autoregressive parameter (ρ) was positive and statistically significant across all models, implying strong spatial dependence on heat exposure, walkability and HWMI.
Conclusion
This analysis applied the Heat–Walkability Mismatch Index framework developed by Lee et al. [6] to Birmingham and found a clear heat–walkability mismatch in the city. As proven with Moran's I, significant spatial clustering of these high-mismatch areas exist in the central of Birmingham.
The mismatch was also socially patterned, as demonstrated by spatial lag regression models. Social vulnerability was positively associated with heat exposure and HWMI, but not with walkability. This suggests that the social patterning of HWMI in Birmingham is driven primarily by inequalities in the thermal environment rather than by differences in the walk-supportiveness of the built environment.
These findings indicate that areas can be walk-supportive while also experiencing the unfavourable thermal conditions. This mismatch was spatially inequitable, with socially vulnerable groups experiencing greater mismatch.
This has implications for local planning. While promoting a liveable environment that encourages residents to travel actively by walking and cycling is a worthwhile aim, improvements in heat resilience should be considered alongside it to reduce heat exposure. Higher social vulnerability was associated with greater HWMI, primarily driven by higher heat exposure rather than differences in walk-supportiveness. The SV measure captures areas with socioeconomic disadvantage, poor health, older people and younger children of which these groups of individuals are sensitive to extreme heat. Exposure and susceptibility therefore coincide where areas with higher mismatch are most likely to be impacted the most with the increase in temperatures. Therefore, prioritising heat-sensitive urban design would align adaptation investment with the council's existing commitments on health inequalities.
The application of the HWMI is intended to raise awareness of the UK's changing climate and to serve as a tool for demonstrating spatial inequity, particularly in a deprived local authority district such as Birmingham. In a country whose urban environment was built historically for a cooler climate and in a local authority with high levels of deprivation, the HWMI can help identify priority small areas where heat-resilience measures should be incorporated into urban design, so that adaptation investment reaches the residents most susceptible to heat and closing the gaps in health inequalities rather than widening them.
Disclaimer
This analysis was independently developed by the author outside of contracted working hours using purely publicly available data. This work was not commissioned or requested by Birmingham City Council. Although the author is employed within Birmingham City Council Public Health, this piece of work is not an official Birmingham City Council publication. Any findings being cited and incorporated into formal BCC publications would be subject to the relevant internal review and approval processes.
References
- UK Health Security Agency. Chapter 2: Temperature effects on mortality in a changing climate. Health Effects of Climate Change (HECC) in the UK: 2023 report. 2023.
- UK Health Security Agency. Heat summary — heat mortality monitoring reports. 2024.
- UK Health Security Agency. Interim heat mortality monitoring report, England: May and June 2026. 2026.
- Department for Transport and Active Travel England. Active Travel — Active England: the third cycling and walking investment strategy (CWIS3). 2026.
- Town and Country Planning Association. Birmingham's vision for liveable neighbourhoods. 2023.
- Lee RJ, Rueda S, Brown K, Zhai W, López Ochoa E, Coleman E. Walkable but not walkable? A mismatch between urban heat and pedestrian-oriented environments in promoting equitable climate resilience. Sustainable Cities and Society. 2026;148:107622.
- Emrich CT, Cutter SL. Social Vulnerability to Climate-Sensitive Hazards in the Southern United States. Weather, Climate, and Society. 2011;3(3):193–208.